The following document is the original text of my Diploma thesis. Please be aware of that the work may contain mistakes. I have been continuing working with the data and found some of the analyses and results questionable!
Corrections of the vegetation part are published.
in co-operation with the Institute of Ecology / FSU Jena and the University Courses on Svalbard (UNIS)
to the top of the page
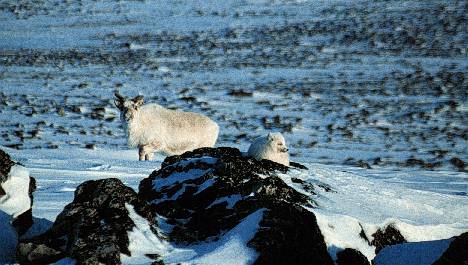
The few species of terrestrial mammals living all year round in the High Arctic have to face a highly seasonal physical environment. Cold temperatures and strong winds during the Arctic winter impose very high energy requirements. The light regime changes dramatically, from permanent darkness during winter to 24 hours daylight during summer. The strong seasonality of this environment is likely to select not only for physical but also for behavioural adaptations that combine to facilitate survival.
Light is used as a cue for the timing of dial and seasonal rhythms (Krebs 1994) and physiological cycles (e.g. reproduction, antler cycle and seasonal change of fur) and behavioural patterns are dependent on light conditions. The few studies dealing with behavioural adaptations of Arctic mammals in wintertime under changing light conditions deal with physiology, energy budget and behaviour in Arctic regions (Nyholm 1974, Roby 1979, Risenhoover 1986, Russell and Martell 1986, Eloranta et al. 1992, Schaefer and Messier 1996). However, no study has yet investigated the variety of behavioural adaptations to the harsh and seasonal environment. To reach a better understanding of this variety it is of advantage to work with one species.
Svalbard is a convenient location in which to study spatial and temporal adaptations to the seasonal environment of the high Arctic since it lies at approximately 75°N-81°N. Only two terrestrial mammalian species are native on Svalbard, the carnivore polar fox (Alopex lagopus ) and the herbivore Svalbard reindeer (Rangifer tarandus platyrhynchus ). Earlier introductions of muskoxen (Ovibos moschatus) failed (Klein and Staaland 1984).
The Svalbard reindeer population is an island population without any natural predators and the animal's behaviour, anatomy, physiology and distribution differs considerably from that of its mainland relatives (Tyler and Øritsland 1989, Cuyler and Øritsland 1993, Mathiesen et al. 2000). The insular reindeer is well adapted to Arctic constraints and the extreme seasonality and posses special morphological characteristics that assist in resisting the extreme conditions. In particular it has compact body, short legs and long, thick, fur. This fur consists of a specially developed hair that provides superb thermal insulation (Tyler 1990). The animal also has large, cloven hooves that reduce the likelihood of breaking through the snow crust and so enable it to walk more easily on snow (Tyler 1990). In addition Svalbard reindeer are able to restrict heat and water loss to a high extent through their respiratory system (Tyler 1990) that has a high proportion of blood vessels absorbing the condensing respiration water vapour. The Svalbard reindeer's energy budget differs from that of other reindeer. A reduced basal metabolism in winter diminishes their daily energy expenditure (DEE), but nevertheless, Svalbard reindeer undergo the most extreme seasonal change in body weight compared to other Rangifer subspecies. During fall the dissectible fat proportion decreases by ca. 20% and the total weight declines by 29% during winter (Tyler 1990).
Light has a strong effect on the biological clocks of the reindeer since they are set by sunrise and sunset (Van Oort et al. 1999). Biological clocks are defined as internal or innate timing or time measuring mechanisms within organisms. The pineal hormone melatonin might link different biological clocks when the amplitude of the change in concentration is large enough. When the amplitude gets weak or disappears the clocks drift in different directions (Van Oort pers. comm.), resulting in irregular and unpredictable activity patterns. In presence of the light cue the reindeer have a nychthemeral activity pattern, i.e. being equally active during night and day (Maier and White 1998).
Temperature and snow also bias the activity and the Svalbard reindeer population is mainly regulated by weather, particularly the presence or amounts of snow and ice, since these restrict forage availability during the winter (Reimers 1977, Reimers 1983, Aanes et al. 2000). To meet its energy requirements, reindeer have two possibilities: (1) it can increase its foraging activity to get the greatest possible amounts of nutrients or (2) minimise its daily activity and foraging. The latter saves energy costs for locomotion and metabolism (Cuyler and Øritsland 1993).
Snow and ice restrict vegetation growth in Svalbard for almost nine months of the year. In consequence , Arctic herbivores have little surplus energy intake and are therefore under great pressure to be energetically efficient. The energy budget is influenced by several variables; including the distribution of food, physical parameters and environmental factors. Animals must adjust these factors in order to maximise energy gain wile reducing the costs of foraging. Reindeer winter foraging sites must therefore be easy accessible. Such conditions occur only at exposed locations where snow is removed by the wind and accumulation is therefore low. However, these sites are generally characterised by bryophytes and lichens, with only a few vascular plant species (Elvebakk 1994) and, in winter, the nutritional content of these vegetation types is low. At this time vascular plants and lichen mainly consist of cellulose matter (Van Soest 1994, Aagnes and Mathiesen 1994). The reindeer can cover their food requirements during winter by changing to a diet of lichens and plants with high cellulose content during fall (Mathiesen and Orpin 1986) and their gastrointestinal microbial flora changes during this time (Mathiesen and Orpin 1986, Van Soest 1994, Alterskjær Olsen et al. 1997). In addition, the reindeer gastrointestinal tract has considerable plasticity, and is able to adjust to the temporal heterogeneity of food supply (Sørmo et al. 1999). However, climatic events like rainfall in winter can limit access to the few suitable forage sites available since, after rain, the water freezes covering the vegetation with a thin layer of ice. Under these conditions the reindeer find great difficulty in foraging effectively and, consequently, such events often lead to starvation episodes. Experimental studies show that starvation reduces the rumen fluid flow rate leading to a lower net salivary flow (Van Soest 1994) and this further reduces the rumen pH and thus also the rumeno-bacterial density (Alterskjær Olsen et al. 1997). As a consequence, with fewer rumen bacteria to break down low-quality forage, the uptake of nutritients is still further reduced.
As well as being limited by the availiability of sites where foraging time is low, the reindeers' own digestive capacity, as in other ruminants, limits maximal food intake (Belovsky 1984). Furthermore the time for searching and handling has to be considered. It is a combination of ingestion and digestion while rumen passage is limiting (Hanley 1997). The time the reindeer spent feeding is dependent on the availability of forage, forage quality and range quality (White and trudell 1980, Van Soest 1994, Schaefer and Messier 1996, Mysterud 1998, Van der Wal et al. 2000b). To a high degree, these factors are determined by temperature snow cover, and light conditions.
The seasonal and daily activity patterns of northern ungulates are influenced by weather and light factors which can either alter activity budgets or generate differences in foraging bout length during the season (Olesen 1987, Côté et al. 1997: muskoxen, Green and Bear 1990: elk, Gillingham and Klein 1992: moose). The size, number and quality of available foraging patches are other variables that have to be considered in the optimisation of foraging. Optimal foraging theory predicts that a few large feeding sites, far away from each other, will be exploited to a greater degree than several small patches with large distance inbetween. Group foraging and thus high behavioural synchrony can increase the individual feeding rate by the means of sharing information (Clark and Mangel 1984), but at the same time increases intraspecific competition. However, intraspecific competition is likely to play a minor role (Tyler 1987b), even though resources affect and respond to the density of the reindeer. Resources density is revealed by the high densities of reindeer where vegetation growth is rich and low densities of reindeer where primary production is low (Tyler 1987b, Øritsland and Severinsen 1990, Øritsland 1998). Additionally a strong reduction of bush-forming lichens at places with grazing activity has been observed (e.g. Wegener et al. 1992, Van der Wal submit.).
This study appraises factors influencing spatial and temporal activity patterns of Svalbard reindeer throughout the winter and spring. The aim was to describe the seasonal activity pattern and habitat use of Svalbard reindeer to evaluate the influence of changing light and weather conditions. The reindeer were observed from January to May for several hours a day. To respond to the question if any aspects of behaviour are related to environmental variables analyses were focused on the activity budget. At the same time foraging and resting bout length and synchronisation were examined. Additionally vegetation type use was analysed because their availability and composition also might have an influence on the behaviour of reindeer.
to the top of the page
Fig. 1: Map of the Arctic. The circle marks the archipelago of Spitsbergen.
to the top of the page
The study was conducted at Nordenskiöld Land on Spitsbergen. The Archipelago is situated at a latitude between approximately 75şN to 81şN (fig. 1). During winter the sun stays below the horizon for more than three months, whereas in summer it is above the horizon permanently (fig. 2).
The West Coast of Spitsbergen, and the area of Nordenskiöld Land in particular, is characterised by a relatively temperate but dry climate. The minimum average temperature is -15.0şC4.2 in the coldest months (January to March) and maximum average temperature is 4.3şC0.9 (June to August, Førland et al. 1997). Annual precipitation on the West Coast is approximately 400 mm 180 per year (Førland et al. 1997).
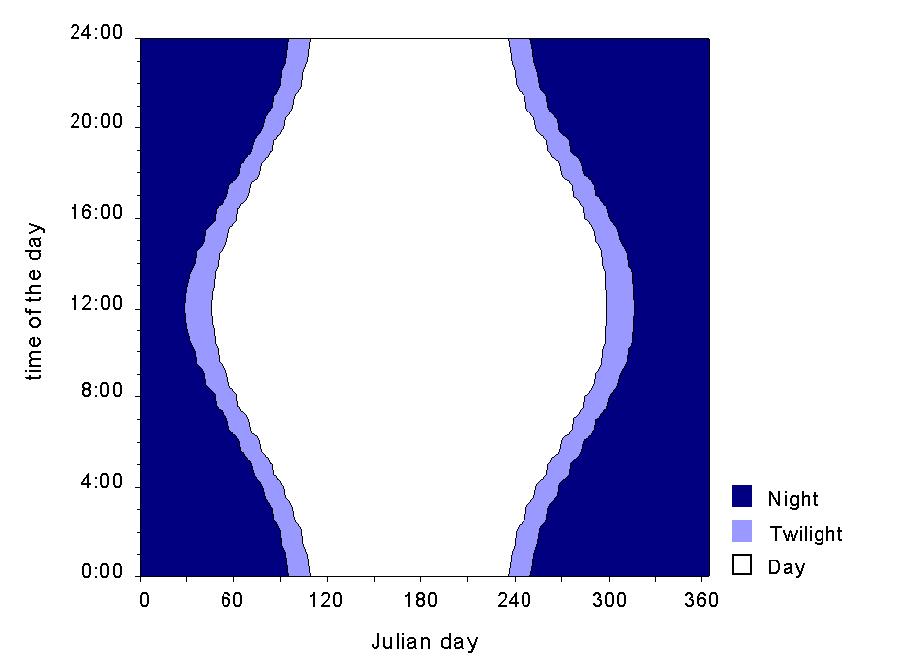
Fig. 2: Sun diagram for the geographical position of Longyearbyen/ Spitsbergen.
Wide valleys and flat-topped mountains formed during the Quaternary ice ages by glaciers and rivers, mark the landscape in the study area. The present-day coastal areas were then marginal to the ice sheet, but now consist of only a low plain or flat strand. Erosive melt water drainages are normally found at places with soft rock types. The ground in Svalbard is permanently frozen, due to continuously low temperatures and so the bedrock has become ice-cemented. Hexagonal patterns mark the ground in dryer places as a result of freeze and thaw cycles and larger valleys are characterised by pingos, small hills with an ice core inside. At Nordenskiöld Land enormous glacier-covered areas are missing compared to other regions of Svalbard, making it more suitable for plant and animal existence. Temperatures above zero produce an 'active' layer upon the permafrost during summer when the soils are able to thaw to approximately 1 m in depth. Due to alternate freezing and thawing of the rocks, block fields are formed on the slopes. Here vegetation growth is sparse, and often restricted to lichens. There is a high annual variation in soil moisture from flooding conditions in spring during the snowmelt to very dry ground in fall. The frozen ground restricts drainage and can waterlog the active layer. The ice acts as a mechanical barrier for roots, but nevertheless plains, riverbeds and foothills have a dense and rich flora. This varies from high moisture vegetation types on the plains to very dry vegetation types towards the slopes (tab. 1). (Stonehouse 1989, Callaghan and Jonasson 1995, Fogg 1998)
Tab. 1: Vegetation types from dry to wet (after Van der Wal et al. 2000a)
| Vegetation type | Characteristics |
| Polar desert | Virtually non-vegetated, characterised by Papaver dahlianum |
| Ridge vegetation | Low vegetation cover (generally less than 20%), Dryas sp., Cassiope sp., Salix sp., Polygonum sp., Saxifraga oppositifolia |
| Luzula heath | Luzula sp., Salix sp., Poa arctica, sometimes with Alopecurus sp. |
| Graminoid sward | Poa arctica, P. alpigena, Festuca cryophila, some Alopecurus sp. |
| Alopecurus-Equisetum-wet moss | Hummocky structure, moss dominated, Alopecurus sp., Equisetum arvense |
| Phipsia (late snow melt) | Phipsia sp., Saxifraga hyperborea, Ranunculus pygmaeus |
| Dupontia-Eriophorum marshes | Dupontia sp., Eriophorum sp., Ranunculus spetsbergensis |
to the top of the page
The taxonomy of reindeer and caribou is still discussed (Hakala et al. 1985, Gravlund et al. 1998). The Svalbard reindeer is supposed to descend from the Eurasian large-bodied reindeer (Gravlund et al. 1998). The small-bodied Peary caribou (R. t. pearyi) and the extinct East Greenland caribou (R. t. eogroenlandicus) are considered to be convergent developed ecotypes to the Svalbard reindeer with different ancestry (Gravlund et al. 1998). Earlier studies assumed a relationship between reindeer from East Greenland and the Svalbard reindeer (Hakala et al. 1985).
Population estimations show that the total number of reindeer on the Svalbard archipelago amount 10 000 to 11 000 animals (Øritsland 1998). They feed in small groups of 1-8 animals (Staaland 1986, Tyler 1987b). Groups of several such foraging bands, between which animals move from band to band, form sub-populations but animals normally do not move between sub-populations nor migrate from their area (Tyler 1987b, Tyler and Øritsland 1989, Loe 1999).

Fig. 3: Map of Svalbard and the study area. The circles mark different observation areas at Nordenskiöld Land: (1) Bjørndalen, Todalen, Adventdalen, Mälardalen and Helvetiadalen. (2) Fardalen, Bødalen, and Colesdalen. (3) Semmeldalen and Reindalen. (4) Vårsolbukta.
to the top of the page
The data were collected between January and May 2000 and additional fieldwork for vegetation descriptions was carried out during one week in June and two weeks in September. The study area included Mälardalen, Adventdalen, Helvetiadalen, Todalen, Bødalen, Fardalen, Bjørndalen as the northern study areas, and Colesdalen, Semmeldalen, and the plains on the West Coast as the southern study areas (fig. 3).
Behavioural observations were made at different times of the day, in general for five to eight hours. The duration of an observation period was dependent on weather conditions and field assistance. Weather could reduce the duration of observation to three hours but also extend it to 12 hours. Animals were often difficult to detect during winter darkness and under these conditions the first group of animals containing a minimum of 3 individuals was chosen for observation but during light periods the group had to contain at least 4 individuals before being selected for observation. The observation locations were reached by snowmobile and observations started 15 minutes after arrival.
Observations were aided using a night vision device (x 3,5 magnification), a spotting scope (x 20-60) and field binoculars (8 x 42, 10 x 50). The activity of the chosen animals was recorded every 10 min using the scan-sampling method (Altmann 1974). At the beginning of the study, animals could only be identified as either calves or adults due to limited observer experience or bad light conditions. All individuals born within the previous year were defined as calves but did not include new-borns since the fist animals of the new generation were born after the behavioural observations were finished. The category of adults also includes yearlings, but the occurrence of the few yearlings identified were especially noted. Under light conditions adults were classified as males and females but calves were not sexed.
If possible more than one group was monitored. Preferably, one persistent place per observation was chosen so as not to disturb the animals. Nevertheless, when the reindeer were active, their movement meant that it was not always possible to stay at exactly the same observation location. Weather conditions or topography could also restrict visibility between the reindeer and the observer.
Seven behavioural categories were distinguished: laying or resting, standing, feeding, cratering, searching, walking and social interactions. The behaviour was defined as described in tab. 2.
Except resting, all behaviour categories and a few types of behaviour not included in these categories (e.g. playing, preening) were noted as active. All lying animals were defined as 'not active', because in darkness or at long distances it was not possible to distinguish between ruminating, sleeping or observing behaviour while the individual was lying down.
Aggressive social interactions of individuals were compared concerning possible differences between age classes, sexes and animals with different antler quality. The antler quality was ranked into four classes: no antlers, only one antler, two poor developed antlers and two strong, well-proportioned antlers.
Groups observed for more than 80 min were used to estimate synchrony and determine bout length in resting and activity. A resting period was defined, if the proportion lying in a group was more than 50% and lasted for more than three observations (0.5 h). Did a proportion lower than 50% lying interrupt this period one or two times it was still assumed as a resting period. For the active period the opposite of the resting bout definition applies.
Precipitation and snow conditions were recorded once during the observation period. Precipitation got the ranks from 1 to 6; where no precipitation got the rank 1, fog the rank 2, low, medium and much snow fall the rank 3 to 5 and snowdrift the rank 6. Snow hardness was estimated at the observation position and was categorised into five groups containing the snow characteristics powder (1), dense packed snow (2), snow crust (3), ice (4) and wet (5). Additionally, other meteorological data were obtained from two weather stations, one in Adventdalen and one in Semmeldalen (fig. 3). Data from Semmeldalen have only been measured until the beginning of May, but were more representative for the data collected in the Southern regions.
To estimate the use of different vegetation types the vegetation was characterised in June and September 2000. This was done at approximately the same positions where animals were observed in winter. Positions were measured with help of GPS (Global Positioning System). The vegetation studies were done in a coarse manner. The diversity of the vegetation and topography at a smaller scale was not considered. The dominant vegetation type was described at the feeding place. For that the slightly modified classification after R. van der Wal was used (Van der Wal et al. 2000a). All vegetation types used by the reindeer were grouped into a few main types (tab. 1).
Tab. 2: Definition of the behavioural categories used during the investigation.
| Activity | Definition |
| Lying/ Resting | The animal lies on the ground either attentive, ruminating or the head bedded on the front legs. |
| Standing | The animal does not move and has the head at or above breast level. It ruminates, observes or has an alert position. |
| Feeding | The reindeer stays with the head bowed to the ground, and it either grazes or moves on slightly while chewing or scenting. |
| Cratering | The deer scrapes with a front leg on the ground or digs in the snow. |
| Searching | The animal walks slowly with its head bowed towards the ground. |
| Walking | This includes all movements with the head at or above breast level, including trotting and running. |
| Social interactions | This includes all warning signs from head movements towards other individuals coming to close to real antler contact, struggling with front legs and chasing group members. |
| Active | Standing, feeding, cratering, searching, walking and social interactions are composed in this category. In addition behaviours not explained by the former categories (e.g. playing, preening) were included. A few times at night only resting or active could be distinguished. |
to the top of the page
The Kappa coefficient of synchronisation ( ) was estimated based on the analyses of Rook and Penning (1991) to find out the proportion of synchronisation between animals of one group during each scan. Six different categories were used (lying, feeding, searching, walking, standing and cratering). While the Kappa statistic assumes a constant number of individuals per observations (k) in the estimation of the variance (var()) the average of the number of individuals per scan (a) was used instead of k to take the unequal number of individuals per scan into consideration. The variance was than calculated as
 , , |
(1) |
with P(E) being the expected proportion of synchrony, N the number of scans and pj the number of objects in each behavioural category (Siegel and Castellan 1988, Rook and Penning 1991).
Is the -coefficient close to 1 high to complete synchronisation is indicated, while a -coefficient close to 0 indicates very low to no synchrony.
To test the hypothesis that synchronisation is increasing with increasing light conditions a regression analysis was done. The -coefficient was weighted with yyy to consider the varying N in the groups.
The -coefficient was also used to calculate the synchronisation between groups. All observations within one week were included in one calculation. K is the number of overlapping observations in that time, corresponding to a in equation (1). The two behavioural categories considered were active and not active. A group was defined as not active when the proportion of inactive animals in this group was  50%.
50%.
For comparison of distances moved during the study period the individual position was calculated from the observers position, the estimated distance between observer and animal, and the angle from the observers position to the reindeer.
To test the variation of distances moved during the winter season the distances moved per hour (D) were estimated with help of a program for home range analyses RangesV (Kenward and Hodder 1996). The sum of the distances moved by one individual throughout the entire observation period was calculated for several reindeer. To compute the distance moved per hour the total estimated distance of one individual was divided by the duration of the observation (tm ). This is shown in equation (2):
 , , |
(2) |
where xi is the distance moved at a certain scan.
It was tested whether D was different from January to May for males and females and calves, yearlings and adults using a One way ANOVA test. The tested variable was  to meet the criteria of normal distribution.
The influence of different environmental variables on the eight behavioural categories was tested with a canonical correspondence analysis (CCA). The method was chosen for an assessment of the importance of the environmental factors to different behaviour in reindeer. The behavioural observations composed one matrix and the environmental data formed the second matrix. Both matrices are compared in a multi-dimensional manner. The eigenvalues represent the amount of variation in the behavioural matrix that is explained by a particular axis. (Ter Braak 1986, Ter Braak and Prentice 1988, Palmer 1993, Ter Braak 1995, Ter Braak and Verdonschot 1995, McCune and Mefford 1999)
The behavioural categories tested included resting, standing, feeding, cratering, searching, walking, social interactions and active. Not observed categories got zero values, but zero values in a complete row of the matrix (i.e. resting, standing, feeding, cratering, searching, walking and social interactions = 0) are not accepted by the analysis. Therefore, the category active was included with regard to the statistical data matrix, because activity was not always grouped into the tested categories (see data collection).
Abiotic variables like temperature, humidity and global irradiance (i.e. total short wave irradiance on a horizontal surface) formed the second matrix. Global irradiance is a measure for light intensity. Abiotic data were assigned to the observation locations. Weather data from Adventdalen weather station was related to observations from valleys from the northern study area, and data from Semmeldalen weather station was linked to observation data further south (fig. 3). The scanning was not biased towards special weather types.
To estimate the relationship between reindeer use of vegetation types and time of season, cross-tabulations were applied. The Chi-square cross tabulation was used to find out if the use of vegetation types and the season are dependent on each other.
The probability values were significant if p < 0.05. Statistical analyses were done with SPSS 10.0, SAS 6.12 and PC-ORD 4 for Windows.
to the top of the page
Group size did not differ during the observation period, although it was highly variable (fig. 4). In the wider valleys variation in groups size was significantly higher, and animals were more spread than in small valleys (Mann-Whitney-U Test: Nl = 75, Ns = 17, p = 0.001). Individual exchange between groups was more usual if many animals occurred in different large wide spread groups. Spatial segregation could be observed for many adult males during the observation period, while females, calves and yearlings often formed groups together.
to the top of the page
The temperature profile showed a strongly fluctuating pattern during the study time. Its maximum remained at -1.5şC in February and its minimum at -28.4şC in March. Also the wind speed varied extremely with a maximum measured velocity at 12.5 m/s (fig. 5).
Fig. 4: Reindeer group size from late January (Julian day = 20) to the begin of May (Julian day = 150). The graph on top shows the changing light conditions during this time.
Fig. 5: Profiles of the daily averages of temperature (a) and wind speed (b) from January to May. Measurements were taken every hour. The graphs show the daily averages.
Tab. 3: Axis summary statistics. There are 3 canonical axes. The total variance ("inertia") in the species data is 1.9. The eigenvalues represent the amount of variation in the behavioural matrix that is attributed to a particular axis. An increase in the eigenvalue correlates directly to a rise in variation due to the attributing factor. The correlation coefficients for the Pearson correlation are coefficients between sample scores for an axis (from behaviour category data) and the environmental sample scores.
| Axis 1 | Axis 2 | Axis 3 | |
| Eigenvalue | 0.011 | 0.009 | 0.001 |
| Variance in behaviour data, % of variance explained | 0.6 | 0.5 | 0.1 |
| Pearson Correlation | 0.181 | 0.121 | 0.084 |
The low eigenvalues of the CCA analysis show a weak but significant relationship (Monte Carlo test: all axes: p = 0.01) between the behaviour and temperature, light conditions (solar irradiation) and relative humidity (tab. 3, 4, 5). The higher the eigenvalue the more of the variance in the behavioural data is explained by the respective axis. The canonical values of the behavioural values describe the position of behavioural category to the axes explained by environmental values (tab. 5). The first axis is a humidity gradient (tab. 4). Feeding, resting and searching were behaviours that occurred at low humidity values. Fighting, cratering, walking and standing occurred at high relative humidity. The second axis correlated with a gradient in temperature (tab. 4). Resting behaviour was associated with high temperatures, walking, feeding and searching were associated with moderate temperatures, and cratering, standing and fighting with extremely low temperatures. The third axis was a gradient of solar irradiation (tab. 4). The category fighting was strongly related to very low irradiance values while all others tended to occur at moderate values.
Tab. 4: Correlation for the three abiotic variables. The intraset correlation indicates the strength of correlation between environmental variable and the respective canonical axis. They derive from scores between environmental axes and canonical axes.
| Correlation* | |||
| Variable | Axis 1 | Axis 2 | Axis3 |
| Solar irradiation | -0.237 | 0.013 | 0.971 |
| Temperature | -0.506 | 0.833 | 0.224 |
| Humidity | -0.881 | -0.317 | -0.351 |
* Correlation are "intraset correlation" of Ter Braak (1986)
Tab. 5: Final scores for the eight recorded behaviours. They are a measure for the direction and strength of the relationship between the environmental factor and the behavioural category.
| Axis 1 | Axis 2 | Axis 3 | |
| cratering | -1.550 | -0.357 | -0.094 |
| laying | -0.055 | 0.510 | -0.027 |
| feeding | 0.060 | -0.160 | 0.070 |
| standing | -0.723 | -0.507 | 0.319 |
| walking | -0.077 | 0.003 | -0.380 |
| fighting | 0.372 | -0.682 | -1.947 |
| searching | 1.160 | -0.147 | 0.089 |
| active | 0.013 | -0.161 | 0.019 |
to the top of the page
Intervals of activity and resting did not differ significantly from each other (Wilcoxon Signed Rank test: N = 51, z = -0.52, p = 0.59; fig. 6). The median of the duration of activity was 90 min (N = 103, sd = 62.7) and for the resting bouts 100 min (N = 84, sd = 60.9). Neither the bout length of activity (Xa) nor the bout length of resting (Xn) differed with season (Na = 103, = -0.06. pa = 0.44, Nn = 84, R2= 0.08, pn= 0.42).
Fig. 6: Distribution of the duration of resting (N = 84) and activity (N = 101) bouts for Svalbard reindeer for the whole observation period. The bout length was measured in 10 min intervals (i.e. from 30 to 300 min). Short bouts were more frequent for both active and inactive categories, and they do not differ from each other.
to the top of the page
Svalbard reindeer occur in groups of approximately 2 to 20 animals. A lot of animals were also observed on their own. To estimate the changes in synchrony in activity a -coefficient for different groups was calculated. There was a trend that synchronisation within groups decreases with the preceding winter season (N = 79,= 0.07, p = 0.02; fig. 7a). The data used, include data from the transition time and the following time in complete day light. However, there was no synchrony between groups during the winter season with the changing light regime (N = 19, R2= 0.09, p = 0.20; fig. 7).
Fig. 7: (a) The Kappa coefficient is a measure of synchronisation. Low coefficients indicate low synchronisation between animals. To adjust the unequal numbers of individuals included in every estimate of Kappa cases were weighted by 1/variance of Kappa. The decrease of synchronisation from midwinter to spring was significant (R2 = 0.06, p= 0.02). (b) A small Kappa is equivalent to low synchronisation. To adjust the unequal numbers of groups included in every estimate of Kappa, cases were weighted by 1/variance of Kappa. The regression of synchronisation between groups was not significant (R2 = 0.09, p = 0.20).
Fig. 8: Pie chart showing the estimated proportion of time spent for observed behavioural activities in Svalbard reindeer between the months of January and May. Resting and active behaviour are separated. The main activities are feeding and laying with together 83.3%.
Fig. 9: The trend in resting and feeding from late January to the middle of May shows an increase in time spent resting (a: N = 72, R2 = 0.05, p = 0.07, dotted line) and a decrease in feeding activity (b: N = 72, R2 = 0.06, p = 0.05, continuous line).
to the top of the page
The animals were active 59.8% of the time during the study. They used almost an equal amount of time feeding (43.1%) and resting (40.2%; fig. 8). Other behaviours accounted for 16.7%. There was a decreasing trend in feeding activity from January to May (N = 72,= 0.06, p = 0.05) and a trend that the reindeer rest more towards May (N = 72,R2= 0.05, p = 0.07; fig. 9). The other observed behavioural categories were roughly constant during the study period. There were no differences between night or day activity budget (Wilcoxon Signed Rank test N = 9, p > 0.1).
Fig. 10: (a) In social conflicts males lost more often than females. The bars also include fights between animals of the same sex, resulting in a more unclear difference of losers and winners in the female category. (b) Antler quality was ranked into four categories (no antlers, one antler, poorly developed or small antlers and well-developed or strong antlers). Animals without antlers or with poor antler quality lost more often in conflict situations than animals with well-developed antlers.
to the top of the page
Males were more often seen to loose struggling interactions with other group members than comparable females (fig. 10a). The percentage of aggressive social interactions was not correlated with the season (p = 0.17). I often observed reindeer with antlers ousting members of the group without antlers or with poorly developed antlers. Fig. 10b shows that antler-wearing individuals (mainly females) won more aggressive interactions, than non-antler wearing individuals. Juveniles and males who did not have antlers or just wore small buds were tussling with their front legs in keen conflicts.
Fig. 11: Distances moved per hour were compared between sex classes (a) and age classes (b). There are no differences between the classes. The number of individuals used for the analyses differed (males: N = 22, females: N = 50, juveniles: N = 18, yearlings: N= 19, adults: N= 35).
to the top of the page
The movement of individuals was fairly constant from late January to late May. There was a high variation throughout time, but movement is generally very low ( km/h). Differences between sexes or age classes could not be found (fig. 11). A One way ANOVA test was carried out to find differences between age or sex classes in distance moving per hour. There were no significant differences between age classes (N = 72, p = 0.35) nor between sexes (N = 72, p = 0.36) either.
to the top of the page
The reindeer mainly used five vegetation types out of eight vegetation classes. These included ridge vegetation, Luzula heath, graminoid sward, Alopecurus-Equisetum-wet moss vegetation type and Dupontia-Eriophorum marshes.
The Chi-square cross tabulation shows only a significant dependency ( = 0.1) between increasing seasonality and the wet moss vegetation type (p = 0.08; tab. 6). There is a trend in using moist vegetation types in midwinter, and dry or ridge vegetation types in spring (fig. 12). The same trend is indicated by the symmetric measures of association. While only the ridge vegetation type and the wet moss vegetation type show a significant correlation with the season ( = 0.05, p = 0.04), the values of the correlation imply a decreased use of humid vegetation types with the proceeding season (negative values), and an increased use of dry vegetation types (positive values; tab. 6).
Fig. 12: Use of vegetation types throughout the season Ridge and heath vegetation use increase towards May, while the use of more humid vegetation types decreases.
During darkness reindeer were easily disturbed when approached by the snowmobile. We mainly disturbed resting individuals that then stand in an alert position, sometimes in the coverage of our spotlights. After turning off the spotlights, the animals calmed down and trotted away or started feeding. During daytime, a few observations showed that tourists passing a group of reindeer along a snow mobile track had almost no influence on the animal's behaviour. A few resting animals stood up while disturbed and a few feeding animals interrupted feeding. These animals kept their alert standing position for a short time and then usually continued with their previous behaviour. Reindeer were less frightened when approached by snowmobile than by foot, when we were looking for a suitable observation place. Exceptions to this calm behaviour were shown when we directly approached the individuals. In this case, the alert standing position merged into one or two high jumps with the head as the highest point and the tail in an upright position before they started to run away. They kept the line of their forehead parallel to the line of their back for the whole time. After approximately 50 m they stopped to check the pursuer position. If they were still being chased, the reindeer jumped once more and ran away for a longer distance into more rugged terrain or uphill.
Tab. 6: A Chi-square test was carried out to test weather the use of vegetation type changes with proceeding season. Only the wet moss vegetation type showed a differing trend within a level of significance of p = 0.10. The symmetric measures of the Spearman correlation showed a significant positive correlation between ridge vegetation and season, and a significant positive correlation between wet moss vegetation and season. The algebraic sign of the symmetric measures indicates the direction of the relationship between proceeding season and vegetation type. Its absolute value stands for the strength in the relationship.| vegetation type / month | Chi -- square test | Symmetric measures | |||
| linear by linear association | Spearman Correlation | ||||
| Value | Assymp. Sig. (2-sided) | Value | Std. error | Approx. Sig. | |
| ridge | 2.36 | 0.12 | 0.90 | 0.16 | 0.04** |
| heath | 0.34 | 0.56 | 0.50 | 0.42 | 0.39 |
| graminoid sward | 0.79 | 0.37 | -0.60 | 0.21 | 0.29 |
| wet moss | 3.15 | 0.08* | -0.89 | 0.12 | 0.04** |
| marshes | 0.97 | 0.33 | -0.45 | 0.35 | 0.45 |
to the top of the page
Scanning the behaviour of individuals from distance is an non-intrusive method, as individuals are not disturbed in their natural behaviour. The differentiation of several behaviours is more exact and can be refined over time, in contrast to data loggers. Anyhow, darkness reduces the advantage of this method. Regionally confined wind, temperature and precipitation made the observations very inconsistent concerning time and place. Using the snowmobile when it was dark could lead to disturbance in the normal behaviour of the reindeer before their presence was noticed. Darkness made it almost impossible to differ between age and sex classes.
The observation intervals were shorter in midwinter than in spring, and were sometimes not carried out at the following day, or at the same place due to weather conditions or lack of field assistance. This made it difficult to compare daily behaviour throughout the season.
Use of CCA in behavioural science is not usual. To interpret the output of CCA, an unimodal response of the species to the environment is desired. With this background, high eigenvalues stand for strong environmental gradients (Palmer 1993). Temperature and most behavioural categories might meet this assumption. However, the behavioural variables probably do not respond in that way to relative humidity or global irradiation. Ter Braak (1986) and Palmer (1993) argue that CCA is robust to violations of its assumptions. Furthermore, there are no parametric distribution postulations. High skewness values and high noise levels still achieve good test results (Palmer 1993). The results of the Monte Carlo permutation test included in the analysis for significance of the environmental variables are imprecise since the tested values are very low and the test power is not exactly known (Palmer 1993).
to the top of the page
Neither light intensity nor air temperature, relative humidity or vegetation types had an obvious effect on behaviour. The results of (Nilssen et al. 1984b) might explain that temperature does not have a special effect. They found that Svalbard reindeer increases resting metabolic rates (RMR) not until ambient temperatures larger than -50şC. I expected humidity correlated to temperature because of the higher conductance of water vapour. But, the composition of the fur might keep heat loss by high humidity or water negligible. Thus humidity values might hardly influence effective temperature loss for reindeer. It is uncertain that light does not have any impact on the behaviour of reindeer. However, the data was analysed for changes in proportions of activity and not for changes in the rhythm. The experimental design and the analysing methods did not allow me to look for changes in the daily rhythm. For that, continuous 24 hours observations are necessary, since the time of sunrise and sunset differ very much from day to day at these high latitudes. In addition the statistical methods were not able to distinguish between similar values of global irradiation from early January and early April. But this separation might be important, as a certain amount of light after the period of total darkness is supposed to set the biological clocks of reindeer via the hormone melatonin (Oshima et al. 1987, Yamada et al. 1988, Oshima et al. 1989, Eloranta et al. 1992, Van Oort et al. 1999). With that an almost stable circadian rhythm is created until this cue disappears in the season of the midnight sun (Sharma et al. 1999, Van Oort et al. 1999).
to the top of the page
I did not observe different behavioural rhythms from late January to late May. But, observations were not started until late January. At that time there is already light during midday. In addition, irregular and short observation times might produce noise in the data set. This makes it difficult to detect any regular daily pattern.
Experiments in reindeer showed that the activity becomes arrhythmic in winter and summer during complete darkness (DD) and complete light (LL), respectively. During DD or LL the melatonin rhythm shows no pattern, because of the missing zeitgeber of sunrise or sunset changing the inhibition or induction of melatonin release (Eloranta et al. 1992). Periodic applications of melatonin could not get arrhythmic reindeer back to rhythmic again (Van Oort pers. comm.). Thus melatonin clearly influences locomotor activity, but does not trigger it. In case the light intention in late January is already high enough to produce a signal in the melatonin system, differences in the behavioural rhythms in midwinter and late winter can not be observed. In contrast, rhythmicity changes in spring (LL) might not have occurred yet, because the drifting of the biological clocks need some time before we are able to observe this in the reindeer behaviour.
The time for grazing bouts I could observe are almost half of those found by Tyler (1987b) for Svalbard reindeer in Adventdalen. When I analysed bout length for differences, I could not find variations in the seasonal pattern. In contrast, a significant difference in bout duration of active bouts and resting bouts among seasons was found for caribou (R. t. granti): the time spent resting was longer than the time of activity during wintertime (Maier and White 1998). Gillingham and Klein (1992) did show a similar result for moose: when there were differences in the proportions of time spent active or resting over the winter season, one could expect differences in bout length, too. The data of Maier and White (1998) show that even among the same subspecies, differences occur in daily bout duration. The differences to my results might be due to methodological errors. Stationary and continuous observations or data from radio collars could provide more appropriate data. On the other hand, there is a possibility that Svalbard reindeer do not show these variations in bout length. Disturbance by tourism as an explanation for shorter resting periods can be excluded, as the tourist season does not start until March. As shown above did the proportion of time spent resting even increase with season. Thus the conclusion of Cuyler and Øritsland (1993), that disturbance of animals results in increased activity consequently leading to a negative effect of the animals winter energy balance, might not be relevant for Svalbard reindeer.
to the top of the page
A certain synchrony between animals and groups of animals was expected due to the dependency of the locomotion rhythm to changing light regimes (Oshima et al. 1987, Yamada et al. 1988, Middleton et al. 1996). The results indicate that individuals within the same group show a higher degree of synchronisation as long as the night and day change is evident. Under conditions of complete light (LL), synchrony decreases. However, the data on this has a relatively high variance. Synchronisation between groups could not be found. There have to be other factors in addition to changing light regime, determining the time of activity in Svalbard reindeer. These determining factors might be the body condition or the food quality. Because there is a certain degree of intra-group synchronisation, the behaviour of one individual might stimulate other individuals of the group to elicit the same behaviour. A group feeding at a place with higher food availability might rest earlier than another group that has to move a lot to get the same amount of pasture. Thus topography, snow distribution, and snow quality, influence feeding behaviour quite a lot. Microclimatic conditions change in Svalbard over very short distances (Tyler and Øritsland 1989). Therefore, these conditions can govern the feeding or resting requirements for separate small groups of reindeer.
The low number of individuals within a group as well as a high number of single individuals that could be observed is typical for Svalbard reindeer (Reimers 1977, Tyler 1987b). Life without predation, and migration restrictions because of fjords and glaciers, may have reduced the characteristic flocking behaviour. Also the insulation from the mainland, or other geographical landmasses might be a reason for the reduced flocking strategy. Coats Island caribou (R. t. groenlandicus) appear in small groups as well (Gates et al. 1986). Another important point for group size is the relatively low forage density and abundance. This might result in a higher competition pressure (Klein 1986), which could lead to a reduced group size.
to the top of the page
The observation of the rather high proportion of time spent feeding and lying show us that it is necessary for these ruminants to keep their stomachs filled the whole time (Mathiesen and Orpin 1986). In addition the bad forage quality in winter results in a prolonged turnover time of food (Van Soest 1994).
Svalbard reindeer tend to increase resting behaviour and decrease active behaviour from midwinter to spring. Diet and daily food intake in reindeer and caribou varies throughout the season (White and trudell 1980, Syroechkovskii 1995, Bjune 2000). When the availability of food is low individuals have to decide whether they spent energy searching for new resources or save energy by resting, which means an increased lying time for ruminants (Russell and Martell 1986, Schaefer et al. 1996). The tendency to feed more on ridge vegetation types, and the increasing resting behaviour towards spring, leads us to the assumption that Svalbard reindeer save energy in spring when forage availability is low. The following calving season requires resources, which cannot be build up at this time yet. The decreasing trend in feeding activity from early winter until spring was also found by Nyholm (1974), Russell et al. (1993) and Maier and White (1998) in reindeer and caribou, and Olesen (1987) and Forchhammer and Boomsma (1995) in muskoxen. Conversely Skogland (1974), Reimers (1979), Roby (1979) and Duquette and Klein (1987) observed the opposite or no change at all in reindeer and caribou. The latter authors did not observe at all times of the day, although it seems uncertain that this might constitute these different results. Due to the decrease in quality of the available food plants from fall to late winter, ruminating time should increase due to low nitrogen content in the forage. Low nitrogen content is correlated with a low digestibility because of high amounts of lignin and fibre (Van Soest 1994). Hence, the rumen is filled up, while the digestible content is much lower, resulting in a low rumen turnover in winter and therefore a necessarily prolonged resting time (White and trudell 1980, trudell and White 1981, Olesen 1987, Holand 1992, Forchhammer and Boomsma 1995). Additionally, voluntary food intake in reindeer seems to be dependent on seasonality, and is lowest during winter (Mesteig et al. 2000). Of course the energy requirements are high during the whole winter, but saving energy by longer rests might be equivalent for keeping the energy reserves on a vital level (Cuyler and Øritsland 1993).
The rumen function is linked to the time/energy budget of the animal rather than a measure of forage characteristics (Hanley 1997). Russell and Martell (1986) observed that forage quality has less relevance compared to range quality with regards to time spent resting. The range quality is indicated by food availability. A large area with well available poor forage access during the whole year might be more important than a comparable area with a few high nutritious patches, which are inaccessible because of snow cover in winter. The differences in nutritional value between feeding sites may also explain the high variance in my data, collected at different locations. Yearly controls in body condition in Svalbard reindeer did show (Langvatn, R. unpublished data) that the condition of individuals varies widely between quite closely situated sub-populations.
Assuming that the forage quality did not change during the observation period, the increasing need for rests might be traced trace back to the reduced the daily energy expenditure (DEE) (Cuyler and Øritsland 1993). The DEE while resting is very low in R. t. platyrhynchus (Svalbard reindeer, Cuyler and Øritsland (1993):  ) compared to R. t. granti and R. t. tarandus (Denali caribou: Boertje (1985), European reindeer: Sokolov and Grechkina (1997):
  ). The water, energy and glucose requirements are also lower while resting (Reimers 1977, Larsen 1986, Kreützer Johnsen et al. 1990, Tyler 1990). Because of that, reindeer can eat less in winter and also reduce their total daily activity (Cuyler and Øritsland 1993).
to the top of the page
The availability of only low quality forage during wintertime and the long period of snow covering the vegetation at Spitsbergen might produce quite a high social pressure within a group of reindeer. Svalbard reindeer might have reduced their flocking behaviour during the time they inhabited this archipelago to avoid this. But even in the small loose bands, aggressive behaviour occurs. The proportion of 1.2% aggressive social interactions compared to the total behaviour I observed in Svalbard reindeer is slightly higher compared to the values found in Porcupine caribou and Central Arctic caribou (R. t. granti: 0.6-1.4%, Russell et al. (1993); 0.2%, Roby (1979)) and West Greenland caribou (R. t. groenlandicus: 0.1%, Roby (1979)). West Greenland caribou also lives in small groups like Svalbard reindeer, but Porcupine caribou and Central Arctic caribou occur in larger flocks. Whereas Roby's data seems quite low (Roby 1979), the data of Russell et al. (1993) show a high variance throughout three different years. These values correspond to my findings.
The relative amount of aggressive social interactions might depend on the conditions of the animals and climatic factors. Years with low forage availability due to ice covered vegetation or high snow accumulation might lead to higher levels of aggressiveness. However, herbivores living in groups will make patches less profitable by competition. Therefore, two strategies might develop in a group: (1) scroungers, taking more resources from others than exploring by their own and (2) producers, contributing proportionally more to searching for new resources (Ranta et al. 1996, Ranta et al. 1998, Mottley and Giraldeau 2000). A combination of both phenotypes in a group of foragers might lead to an evolutionary stable strategy (Rita et al. 1997, Ranta et al. 1998, Mottley and Giraldeau 2000). Skogland (1974) describes different social interactions for Norwegian wild reindeer (R. t. tarandus) very precisely. His data confirm my observations of antler wearing females showing dominance within the groups. Antler wearing females show a typical scrounger strategy, while animals with poor developed antlers or without antlers tend to play the producer's role. Thus it is likely that antlers are a sign of an individuals vigour and dominance within the group, because their development is linked to extra energetic costs. The fact that only certain groups of animals wear antlers during certain times of the year is likely to be an evolutionary strategy beneficial to females during calving time. Hence it is not surprising to meet bands solely comprised of males in middle and late winter, when males do not wear antlers.
to the top of the page
Day length does not seem to have influence on the movement behaviour of reindeer. The degree an animal is moving is mainly dependent on its DEE, which again is dependent on the time of year. Moving includes all activities from searching for food, to migration, behaviour associated with being frighten and social interactions. Thus, the proportion of movement compared to other activities reflects the environmental conditions and the physical state of the animal.
Reindeer in the observation area had a very short travel range in general. These distances are slightly lower, but comparable to Tyler and Øritsland (1989). However, there is a certain inaccuracy in the method. Distances were only estimated. Experience showed that short ranges were estimated more exact than longer distances. Additionally the compass bearings measured between the observer and the animal were more exact at shorter distances. Thus, the travel ranges of groups or animals further away from the observer were mainly underestimated.
Loe (1999) observed high site fidelity among reindeer. Proceeding from this, short travel distances are reasonable. There are three main explanations for the low movement rate. (1) A lower travel distance per day reduces the daily energy costs of locomotion, which are higher for Svalbard reindeer compared to Norwegian reindeer (Nilssen et al. 1984a, Tyler 1990). Therefore, costs of locomotion in Svalbard reindeer might be as low as 2% of the DEE (Tyler 1987a). (2) Svalbard reindeer have a lower locomotive efficiency taking into account their short legs (Klein and Bay 1994, Klein 1996). (3) There is no need of predator avoidance and therefore a lower vigilance compared to other subspecies of R. tarandus spp. (e.g. Tyler 1987b, Baskin and Skogland 1997).
Furthermore, topography and microclimate conditions may have an influence. With decreasing snow hardness the net costs of locomotion increase exponentially (Tyler 1990). The large plains sparsely covered with snow in early winter make it possible for the reindeer to cover their energy requirements better by standing in the same area. In late winter the reindeer switch to windblown ridges as main feeding area. Thin ice cover might act like small greenhouses for vegetation growth stimulation. The forage availability is large enough to keep reindeer at these places, instead of migrating over long distances for other available forage.
to the top of the page
The reindeer used mainly wet ground vegetation types during midwinter and late spring, and dry ground vegetation types in spring. This can be explained by low snow accumulation in January and February. Then, precipitation is still low, and frequently strong winds keep the plains open where wetland vegetation mainly occurs. Later on snow accumulates and is hard packed, while windblown ridges with their sparse and dry vegetation become alternative feeding grounds, even if they are low in available forage (LaPerriere and Lent 1977, Nellemann and Fry 1995, Ferguson 1996, Nellemann 1996). The biomass of the ridge vegetation types gets only 50% of the biomass of the graminoid vegetation type (Van der Wal unpubl. data). This ratio is more or less constant throughout the year. Skogland (1984) observed that the Norwegian wild reindeer population (R. t. tarandus) was restricted to chionophobe vegetation types during the period with highest snow accumulation. The same is true of Peary caribou (R. t. pearyi, Adamczewski et al. 1988). The study of White and trudell (1980), conducted from May to August also shows the use of ridge vegetation and upland tundra. At this time the first protein rich buds are available below the thin ice crusts or a thin snow cover, acting as natural green houses. Solar radiation is able to penetrate the thin layer and warms up the soil, inducing growth of the first vegetation (Bjune 2000).
Svalbard reindeer are generalist herbivores. They select pasture for biomass . The low plant species richness and the few species representing main vegetation biomass (Wegener and Odaz-Albrigtsen 1998, Van der Wal et al. 2000b) in high Arctic regions give herbivores fewer occasions to select for specific plant species (Klein and Bay 1994, Klein 1996). They should be rather more fastidious in their patch choice, because of the reduction of food density in some patches by competition, increased differences in patch types and size, and a more contiguous patch structure (MacArthur and Pianka 1966, Klein and Bay 1994).
to the top of the page
In darkness, animals seemed less frightened. One might expect a higher degree of alertness when one of the senses is restricted. It seemed that although the visibility is low they do not use the olfactory sense in a very high extent as illustrated by Baskin and Skogland (1997).
I do not know how active individuals reacted to snowmobiles. Individuals that were disturbed by snowmobile and standing not far from us in an alert position were assumed to be resting. However, when approached, reindeer would assume an alert position until a threshold distance was met, and they would then move away.
Activity near to human settlements was not observed to influence reindeer behaviour. In case of R. t. tarandus, the increased grazing pressure in retraction areas from tourist resorts and other places with human activity, are the main uncertainties for the population development (Nellemann et al. 2000). This is not the case on the sparsely settled Spitsbergen. Reindeer might also become habituated to the fairly strong snowmobile traffic during the tourist season especially when the traffic remains on one track. Duchesne et al. (2000) suggested slight habituation in woodland caribou (R. t. caribou) in the presence of eco-tourists. Admittedly, the numbers of tourist were also important to the extent of disturbance.
to the top of the page
To further improve our understanding of activity patterns in Svalbard reindeer, the method of observation has to be modified. Observations in longer or even continuous intervals at the same place are necessary. For comparison of DD and LL, observations in early January have to be included. For environmental impact on reindeer behaviour, snow depth and hardness have to be measured, and the regional weather conditions at the observation place should be considered. Under these circumstances it should be possible to find out a more clear result about environmental impact.
The study could not show an influence on the behaviour of the Svalbard reindeer by darkness or light. Variations in bout length between winter and spring could not be shown. This might be caused by the observation methods, or perhaps the Svalbard reindeer does not display such changes. Daily rhythms were not found, which is an affect of the sampling method. A higher degree of intragroup synchrony occurs during the transition period. DD and LL weaken the synchrony of individuals within a group. Between groups, no synchrony occurs at all different light regimes. Thus, the results imply the main influences are individual condition and stimulation by light within a group, on the activity pattern.
The switch from wet to more dry vegetation types is probably induced by the snow conditions and topography, because major differences in nutritional value or digestibility of the plants are uncertain during the snow covered season, except in spring when the new protein rich buds become available. Thus reduced energy expenditure in late winter is necessary and reflected by an increase in the proportion of resting with the season. Competition in form of aggressive behaviour even in the small groups point towards the relatively low forage density and abundance in this high Arctic environment. In winter the antler-wearing females were dominant within a group.
All individuals obtain a short travel range. Low vigilance due to absence of predators and a lower locomotive efficiency might explain this.
The complete daily behavioural pattern of Svalbard reindeer is not observed yet. It might be different from other Rangifer subspecies as it lives on a predator free, high Arctic island. An increase in human outdoor activities might also have an impact on the Svalbard reindeer population; passive through the disturbance of vegetation or active through an increasing number of exploring travellers. Therefore more detailed research in this field is needed.
to the top of the page
First of all I want to thank my parents for their patience and their economical support during my long time of study. Without their help it would have been very difficult to continue my studies at Spitsbergen.
I wish to thank my supervisor Prof. Rolf Langvatn for his help in all logistics, his encouragement during my first time of writing and critics and discussion on earlier drafts. Thanks also to my supervisor Prof. Stefan Halle for discussion during the beginning of my project and for his critics on the manuscript.
A very special thanks to Audun Stien, Bob van Oort, Erik Ropstad, Justin Irvine, Steve Cotę, and Rene van der Wal for their very helpful discussions and the possibility to visit their institutes in tromsø and Banchory. They all treated me as an equal scientist, which helped a lot during the not always easy time of fieldwork and writing. Without all the winter field workers of the reindeer project, my study on Svalbard reindeer would have been very monotonous. Many thanks for making it possible for me to join you.
Without the help of the many interested one-year UNIS students, who joined me on my various field trips at night or day, and without the safety lessons of Fred and Jørn, I would not have been able to carry out my fieldwork.
Berit, I always appreciated your help in all kinds of reference emergency as well as your contagious good humour.
I am very grateful for the assistance by Audun Stien, Jens Schumacher, Olaf Fuelling, Steve Cotę and Winfried Voigt in my never-ending statistical questions. And I don't want to forget to give a bunch of flowers to all the people reading and criticising my drafts or my final manuscript: Andrew Davis, Anke Krey, Frank Beuchel, Justin Irvine, Malin Daase, Rene van der Waal, and Stephen Dutton.
This project was partly financed by UNIS. Automatic Weather Station data was provided by and UNIS (Adventdalen) and the Centre of Ecology and Hydrology, Wallingford (Semmeldalen).
to the top of the page
to the top of the page
Appendix i: The Svalbard reindeer varies in the proportion of its time spent in different activities from late January (season 1), early February (season 2) and so on to late May (season 9).
| season | lying | active | feeding | searching | walking | standing | cratering | fighting | |
| 1 | 24.02 | 75.98 | 58.12 | 0.86 | 3.75 | 3.07 | 9.61 | ||
| 2 | 37.07 | 62.93 | 40.63 | 14.77 | 3.83 | 0.96 | 2.05 | 0.68 | |
| 3 | 40.65 | 59.44 | 36.65 | 14.54 | 3.57 | 0.85 | 2.55 | 1.19 | |
| 4 | 32.42 | 64.49 | 49.76 | 4.16 | 5.23 | 2.14 | 0.12 | 1.90 | |
| 5 | 44.82 | 55.11 | 41.64 | 2.03 | 3.52 | 2.51 | 3.66 | 1.76 | |
| 6 | 34.57 | 66.93 | 50.18 | 1.33 | 6.03 | 3.37 | 0.18 | 3.81 | |
| 7 | 55.89 | 43.73 | 33.59 | 2.11 | 3.06 | 1.53 | 2.68 | 0.77 | |
| 8 | 40.89 | 58.49 | 37.49 | 1.11 | 7.83 | 4.37 | 7.42 | 0.28 | |
| 9 | 41.93 | 57.62 | 42.46 | 7.27 | 5.76 | 1.24 | 0.53 | 0.35 |
Appendix ii: statistics for synchronisation between groups (N = 19) during the winter season 2000.
| Group | Julian day | |
Variance |
Std.err. | Group | Julian day | |
Variance |
Std.err. | ||
| 1 | 43 | -0.167 | 0.043 | 0.208 | 11 | 129 | 0.338 | 0.025 | 0.158 | ||
| 2 | 48 | -0.765 | 0.035 | 0.186 | 12 | 129 | -0.200 | 0.124 | 0.352 | ||
| 3 | 53 | -0.200 | 0.144 | 0.380 | 13 | 129 | -0.510 | 0.042 | 0.206 | ||
| 4 | 54 | 0.407 | 0.043 | 0.207 | 14 | 128 | 0.365 | 0.030 | 0.173 | ||
| 5 | 54 | 0.125 | 0.017 | 0.132 | 15 | 128 | 0.635 | 0.048 | 0.219 | ||
| 6 | 58 | 0.325 | 0.057 | 0.239 | 16 | 128 | -0.692 | 0.097 | 0.312 | ||
| 7 | 75 | 0.065 | 0.013 | 0.115 | 17 | 135 | 1.000 | 0.056 | 0.236 | ||
| 8 | 77 | 0.849 | 0.092 | 0.304 | 18 | 135 | 0.151 | 0.124 | 0.353 | ||
| 9 | 91 | 0.515 | 0.030 | 0.174 | 19 | 135 | 0.818 | 0.091 | 0.302 | ||
| 10 | 101 | -0.284 | 0.044 | 0.210 | |||||||
Appendix iii: statistics for synchronisation within groups (N = 81) during the winter season 2000.
| Group | Julian day | |
Variance |
Std.err. | Group | Julian day | |
Variance |
Std.err. | ||
| 1 | 31 | 0.233 | 0.012 | 0.109 | 54 | 78 | 0.589 | 0.057 | 0.240 | ||
| 2 | 31 | 0.357 | 0.002 | 0.044 | 55 | 77 | 0.186 | 0.001 | 0.028 | ||
| 3 | 30 | 0.042 | 0.010 | 0.099 | 56 | 72 | 0.190 | 0.001 | 0.038 | ||
| 4 | 32 | 0.714 | 0.001 | 0.037 | 57 | 78 | 0.100 | 0.027 | 0.165 | ||
| 5 | 33 | 0.589 | 0.031 | 0.177 | 58 | 95 | 0.380 | 0.001 | 0.026 | ||
| 7 | 28 | 0.292 | 0.003 | 0.053 | 59 | 91 | 0.881 | 0.010 | 0.101 | ||
| 8 | 29 | 0.422 | 0.016 | 0.127 | 60 | 91 | 0.672 | 0.023 | 0.152 | ||
| 9 | 29 | 0.010 | 0.049 | 0.221 | 61 | 91 | 0.822 | 0.030 | 0.173 | ||
| 10 | 43 | 0.801 | 0.010 | 0.099 | 62 | 92 | -0.094 | 0.009 | 0.094 | ||
| 11 | 43 | 0.529 | 0.066 | 0.256 | 63 | 93 | 0.387 | 0.003 | 0.051 | ||
| 12 | 37 | 0.459 | 0.027 | 0.164 | 64 | 100 | 0.672 | 0.003 | 0.054 | ||
| 13 | 38 | 0.551 | 0.005 | 0.070 | 65 | 100 | -0.050 | 0.907 | 0.952 | ||
| 14 | 45 | 0.542 | 0.005 | 0.073 | 66 | 102 | 0.330 | 0.003 | 0.052 | ||
| 15 | 45 | -0.125 | 0.451 | 0.672 | 67 | 102 | 0.048 | 0.023 | 0.150 | ||
| 16 | 40 | -0.024 | 0.471 | 0.686 | 68 | 102 | 0.943 | 0.025 | 0.158 | ||
| 17 | 51 | 0.598 | 0.002 | 0.043 | 70 | 101 | 0.004 | 0.002 | 0.048 | ||
| 18 | 53 | 0.798 | 0.004 | 0.065 | 71 | 130 | 0.055 | 0.002 | 0.044 | ||
| 19 | 53 | 0.790 | 0.059 | 0.244 | 73 | 129 | 0.050 | 0.201 | 0.448 | ||
| 20 | 54 | 0.848 | 0.004 | 0.063 | 74 | 129 | 0.130 | 0.003 | 0.054 | ||
| 23 | 54 | 0.586 | 0.039 | 0.198 | 75 | 129 | 0.189 | 0.005 | 0.070 | ||
| 24 | 48 | 0.491 | 0.004 | 0.061 | 76 | 129 | 0.450 | 0.003 | 0.053 | ||
| 25 | 48 | 0.375 | 0.213 | 0.461 | 77 | 128 | 0.414 | 0.002 | 0.046 | ||
| 26 | 50 | 1.000 | 0.004 | 0.063 | 78 | 128 | 0.180 | 0.002 | 0.049 | ||
| 27 | 50 | 1.000 | 0.459 | 0.678 | 79 | 128 | -0.102 | 0.022 | 0.147 | ||
| 28 | 50 | 1.000 | 0.068 | 0.261 | 80 | 128 | 0.296 | 0.002 | 0.049 | ||
| 29 | 49 | 0.413 | 0.003 | 0.058 | 81 | 135 | -0.185 | 0.051 | 0.226 | ||
| 36 | 64 | 0.783 | 0.006 | 0.080 | 82 | 135 | 0.282 | 0.020 | 0.141 | ||
| 37 | 65 | 1.030 | 0.004 | 0.061 | 83 | 135 | 0.489 | 0.112 | 0.335 | ||
| 38 | 65 | 0.133 | 0.029 | 0.171 | 84 | 135 | 0.035 | 0.011 | 0.105 | ||
| 39 | 59 | 0.220 | 0.036 | 0.190 | 85 | 135 | 0.329 | 0.021 | 0.146 | ||
| 40 | 58 | 0.105 | 0.006 | 0.077 | 86 | 135 | -0.005 | 0.038 | 0.196 | ||
| 41 | 58 | 0.230 | 0.006 | 0.077 | 87 | 135 | 0.607 | 0.006 | 0.075 | ||
| 42 | 64 | 0.080 | 0.002 | 0.044 | 88 | 137 | 0.655 | 0.003 | 0.051 | ||
| 46 | 75 | 0.305 | 0.012 | 0.111 | 89 | 138 | 0.522 | 0.001 | 0.038 | ||
| 47 | 75 | -0.191 | 0.017 | 0.131 | 90 | 144 | 0.262 | 0.002 | 0.049 | ||
| 49 | 75 | 0.126 | 0.014 | 0.118 | 91 | 144 | 0.546 | 0.037 | 0.193 | ||
| 50 | 75 | 0.497 | 0.003 | 0.056 | 92 | 144 | 0.714 | 0.118 | 0.344 | ||
| 51 | 77 | 0.461 | 0.008 | 0.087 | 93 | 143 | 0.369 | 0.016 | 0.125 | ||
| 52 | 77 | 0.466 | 0.004 | 0.062 | 94 | 42 | 0.714 | 0.014 | 0.119 | ||
| 53 | 78 | 0.149 | 0.003 | 0.054 | |||||||
Appendix iv: Ranking of precipitation and vegetation type (dry to wet)
| Category | Precipitation | Vegetation types |
| 1 | no | |
| 2 | foggy | ridge vegetation |
| 3 | rare snow fall | heath vegetation |
| 4 | mediocre snow fall | graminoid sward |
| 5 | much snow fall | wet moss |
| 6 | snowdrift | |
| 7 | marsh |
Appendix v: Monte Carlo test results and eigenvalues of the CCA analysis
to be continued